A windows service, designed to run “headless” and unattended in the background, cannot easily employ conventional popup windows to report its activities as a user may not even be logged on. Instead, a service is encouraged to send important communication to the Windows Event Log – an administrative utility that collects and stores messages and events. Once recorded, these messages can be very helpful in troubleshooting problems, for example when a service stops unexpectedly or when it fails to start at all.
Viewing Events from Windows Services
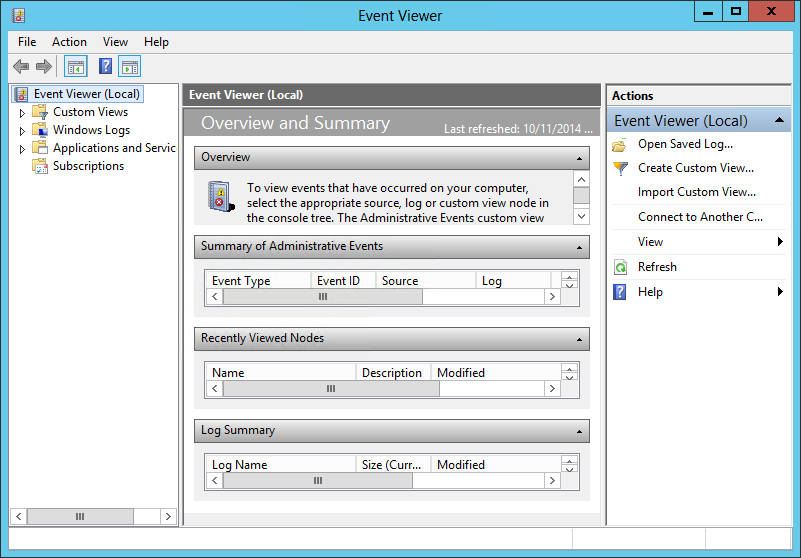
Use Microsoft’s Event Viewer to see messages written to the Event Log. Start the application by clicking on the Start button and typing in Event Viewer, or from the Control Panel (search for it by name). The somewhat cluttered window should come up after a few seconds:
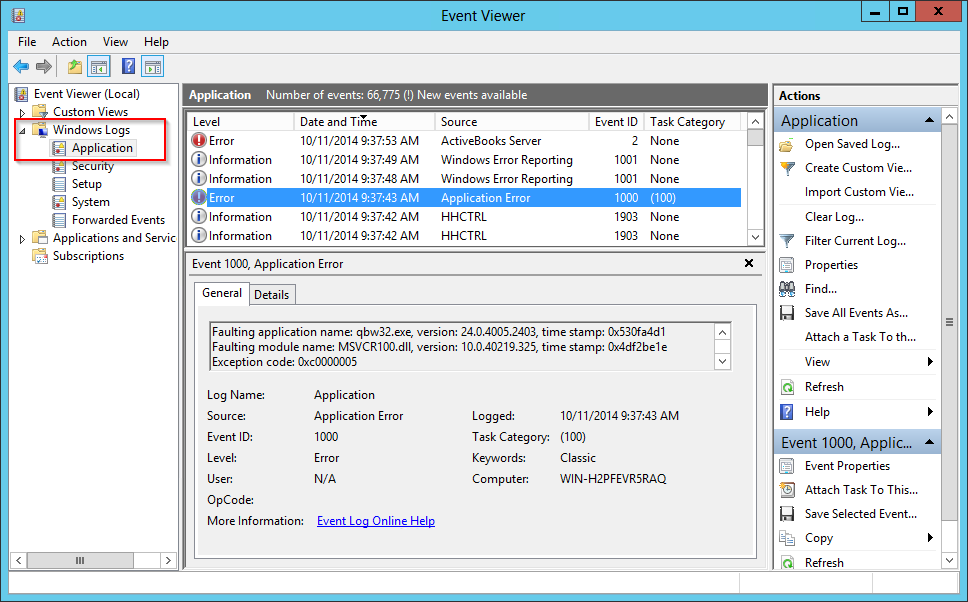
The left hand side shows a tree grouping the various logs captured on your machine. The events from Windows Services (and other applications running on your PC) are filed under
Messages from your windows service will have the display name of the service in the Source column.
Important Components of an Event
The Event Viewer shows over 10 pieces of information associated with each event, including:
- Level – How important is this event?
Each event is classified into one of three categories:
 Information: An informative yet unimportant event. You will probably see a lot of these, and they can be safely ignored unless you are digging into a specific issue from an application or service.
 Warning: A moderately important event. These don’t necessarily signify a failure, and your software will probably limp along, but they should be reviewed regularly to see if anything mentioned can be resolved.
 Error: Indicates a critical problem or failure that may deserve your immediate attention!
 - Date and Time – When did this event occur?
- Source – Which application reported this event?
As mentioned before, an event written by a Windows Service will contain the service’s display name as the Source.
- Description – Which happened?
The full description shown prominently in the lower pane will (hopefully) provide the relevant details of the event.
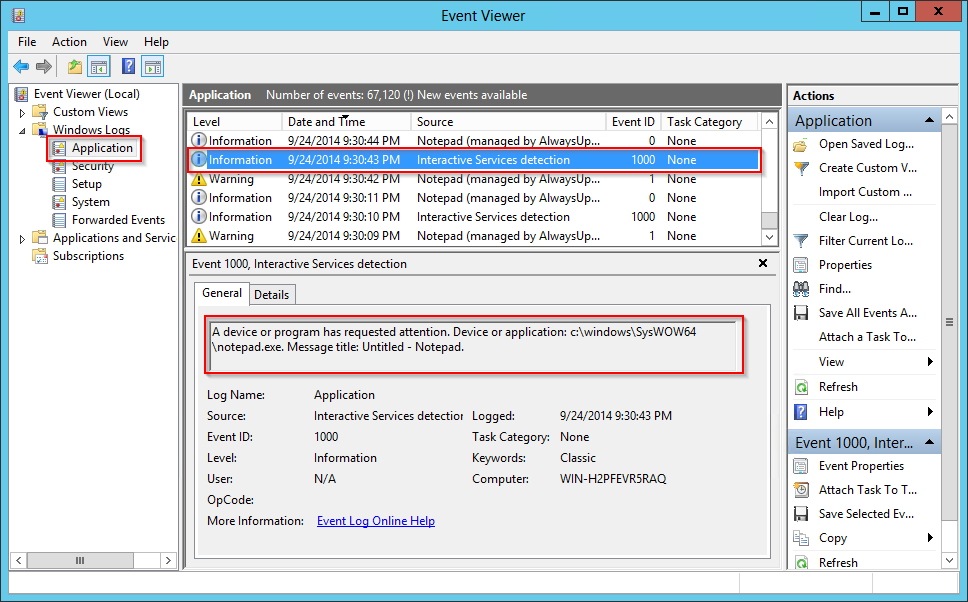
For example, this information event is from the Interactive Services detection service (“UI0Detect”) reporting that Notepad is showing itself in Session 0:
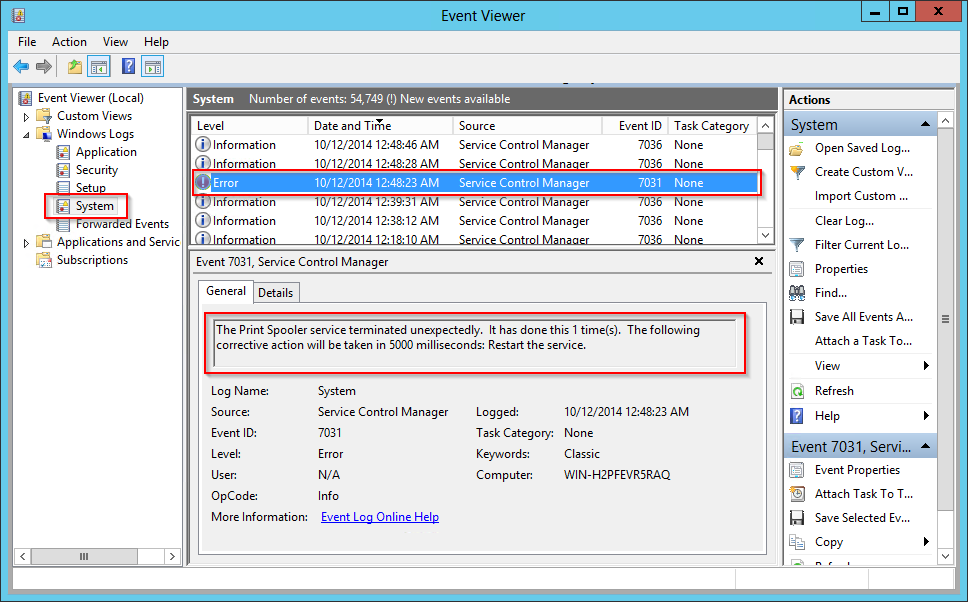
Viewing Events about Windows Services
While the Application log keeps track of events from a running service, the
Viewing Events from AlwaysUp and Service Protector
Both AlwaysUp and Service Protector write messages to the Application section of the event logs (
For AlwaysUp, events from your application named “My Application” will be logged with Source set to My Application (managed by AlwaysUpService). The Event Log Messages Page lists and explains the events reported.
For Service Protector, events related to your service named “MyService” will have a Source of ServiceProtector: MyService.
And for both applications, events related to the starting and stopping of the underlying services themselves appear in the


Thanks for the such a nice post. I am also curious about RAM, CPU performance logs in event viewer for Windows services. Is it even possible?
Hi Akhror.
Windows Services are free to write pretty much anything they want to the event logs, but there is no requirement to log RAM and CPU performance. Indeed, I don’t know of any service that does!
I’m stuck on how to even troubleshoot this problem since I can’t debug and step into the code when I run the service (if there is a way to debug a service, please share).
Yes, it can be very difficult to debug a service! What problem are you facing?
Best practice for debugging a service is to create an executable that can either run as a service or as a regular console application. A command line switch would indicate how the executable should start (in “service mode” or “console mode”).
With that capability in place, you can debug the vast majority of your application interactively. Simply run it in your debugger and break as normal. Only your dedicated Windows service functions can’t be debugged that way.
Hi Steve, at my current internship developed some Windows Services. In the beginning the debugging-process was tedious. Thanks to this helpful Microsoft documentation site: https://docs.microsoft.com/en-us/dotnet/framework/windows-services/how-to-debug-windows-service-applications, which explains the ‘Attach to Process’ functionality, I found an easy method for debugging Windows Services.
Additionally, you may want to write a small PowerShell script, taking care of updating the Services binaries, and starting and stopping the service, while carrying out the update.