Crashes and memory leaks are particularly offensive when the occur in windows services – applications designed to run unattended, 24/7 in the background to perform important tasks. Our AlwaysUp and Service Protector utilities go a long way to diminishing the effect of these insidious failures, but using them is no substitute for finding and fixing a problem at its root.
Developers looking to diagnose failures in their windows services should consider using Microsoft’s Debug Diagnostic Tool. This free desktop application, nicknamed DebugDiag, will monitor your windows service process and create a “dump” describing the state of the application when it crashed (or started using too much memory). You can use this information to narrow down the problem in your own code, or pass it on to the folks who developed the failing service for their expert analysis.
Using the Debug Diagnostic Tool on your Windows Service
Download the Debug Diagnostic Tool from microsoft.com.
Install it. Setup should be quite straightforward, with the usual prompts for a folder, etc.
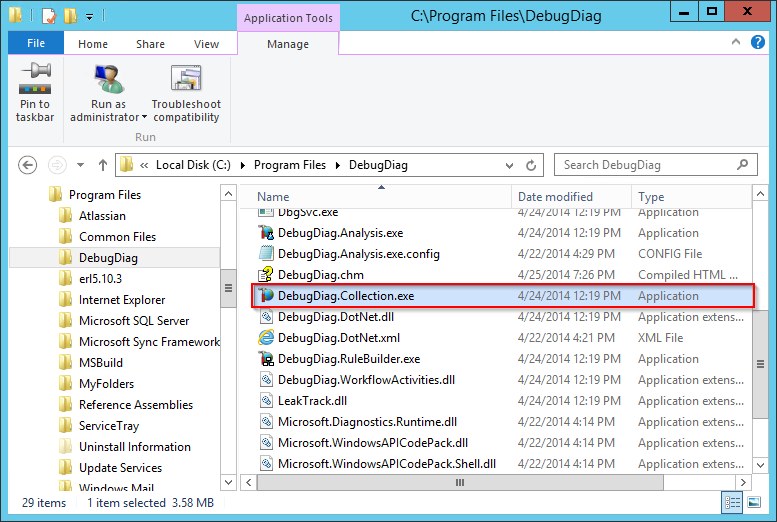
From Windows Explorer, navigate to the folder where DebugDiag was installed (C:\Program Files\DebugDiag by default). Start DebugDiag.Collection.exe – the application that monitors and collects information from a running process or service.
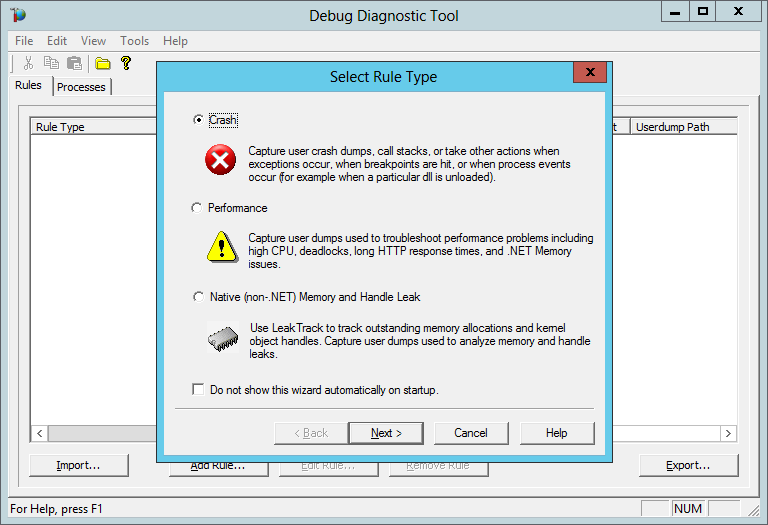
The Debug Diagnostic Tool window should come up and you will be launched immediately into setting up a new “rule” describing what to watch for. From here, you can specify to monitor for crashes, leaks, and even performance-related issues. We’ll select Crash for this tutorial and click Next to move on.
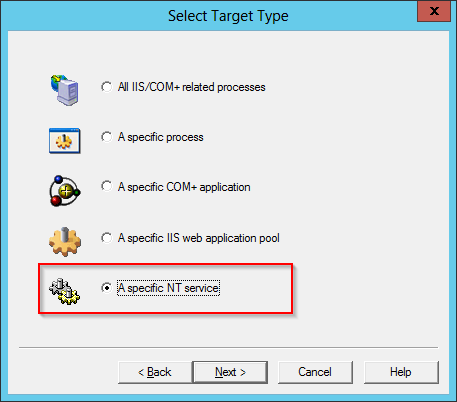
Next, select the A Specific NT service option:
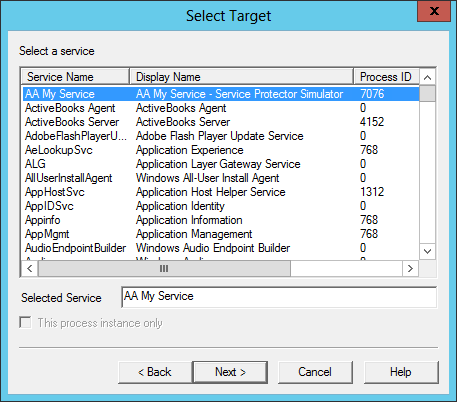
Select the service you wish to debug from the list. We chose “AA MyService”, a windows service we developed to test our Service Protector application. Click Next.
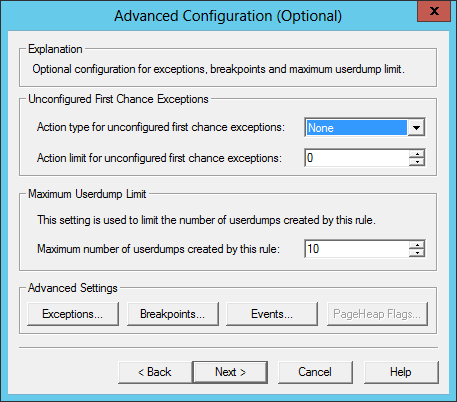
Almost there! Leave the Advanced Configuration settings at their default values and click Next to continue:
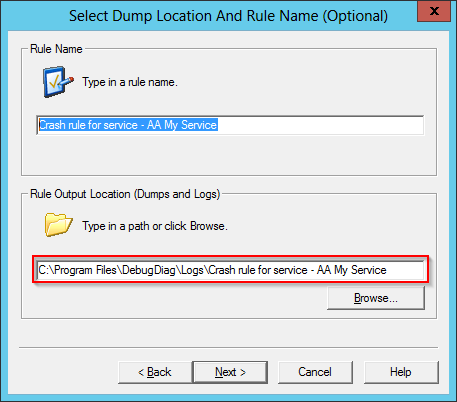
You don’t have to make any changes on the Select Dump Location screen either – just make a note of where the dump file will be saved.
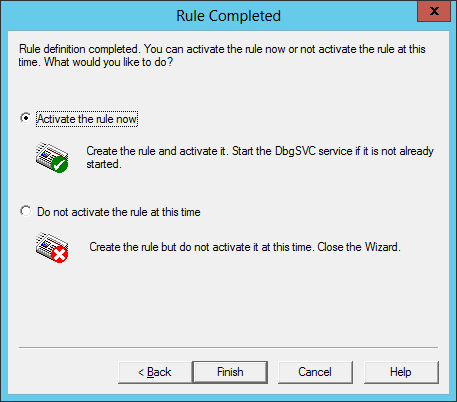
And finally, let’s activate the rule now and click Finish:
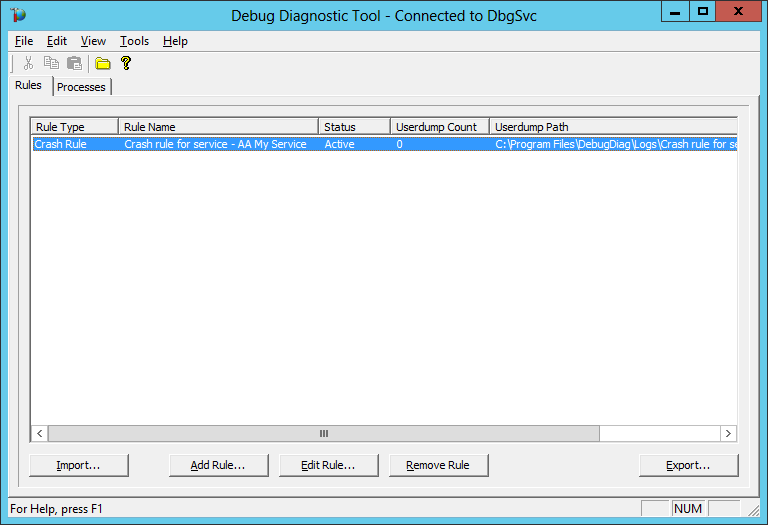
After a few seconds, the tool will be monitoring your windows service for crashes:
Analyzing a Windows Service Crash
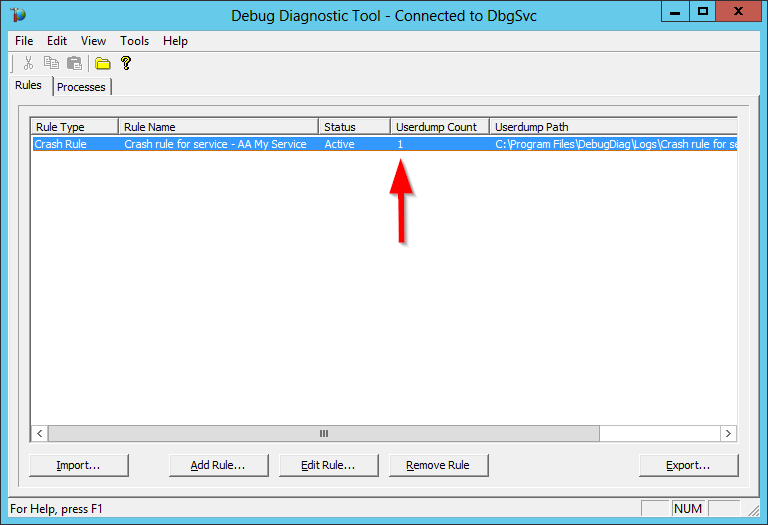
When the service crashes, DebugDiag will record a dump file and increment the Userdump count column. Here we can see that 1 crash has occurred and been captured (with the full path to the dump file noted on the right):
To dig into the dump file:
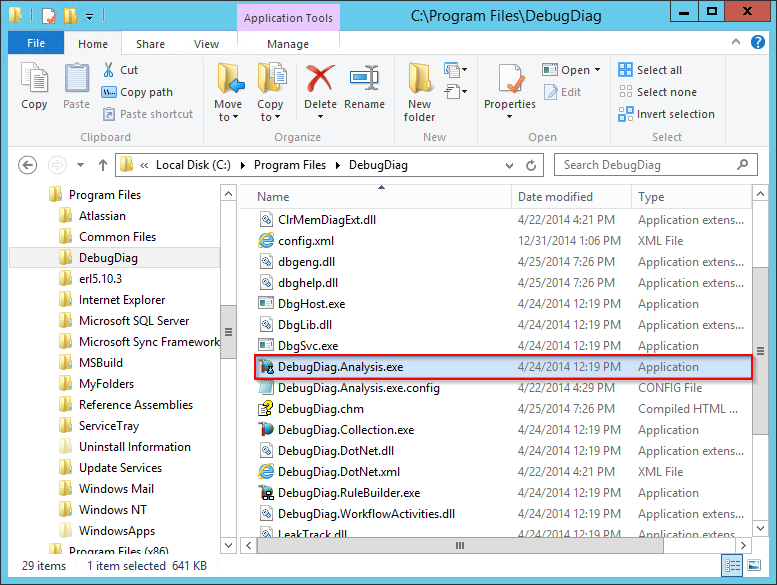
Start DebugDiag.Analysis.exe from Windows Explorer:
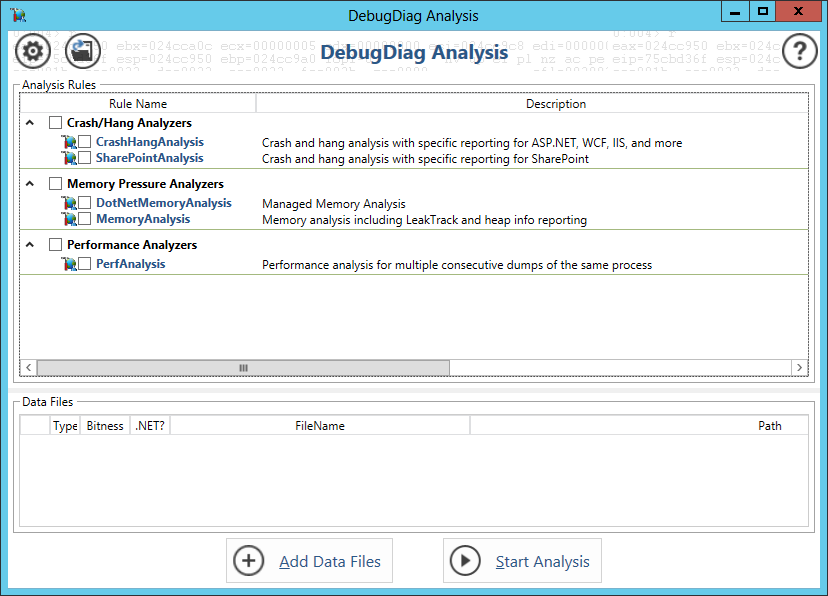
The DebugDiag Analysis window will open momentarily:
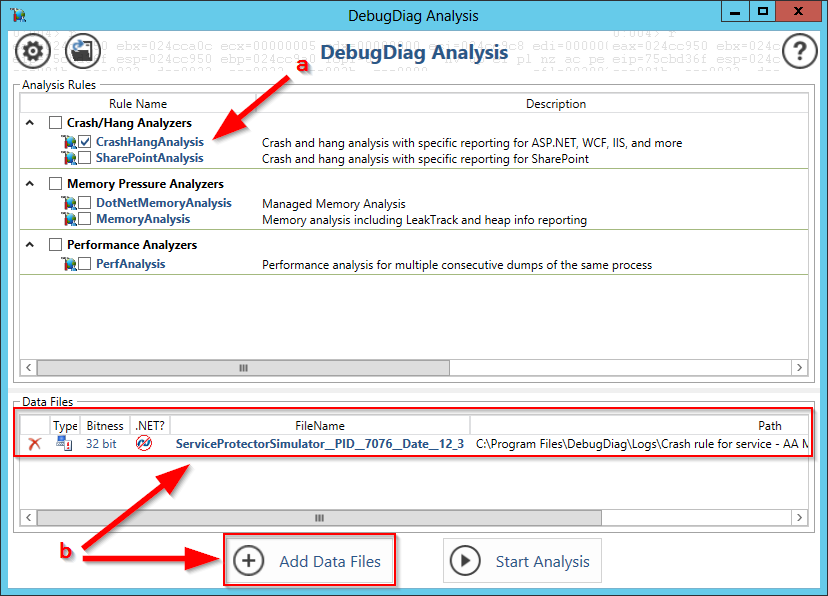
To configure analysis:
- Check the CrashHangAnalysis box near to the top.
- Click the Add Data Files button, navigate to the location of the dump file (it is mentioned in the Diagnostic tool we set up previously) and select it. A new entry should show up in the lower pane.
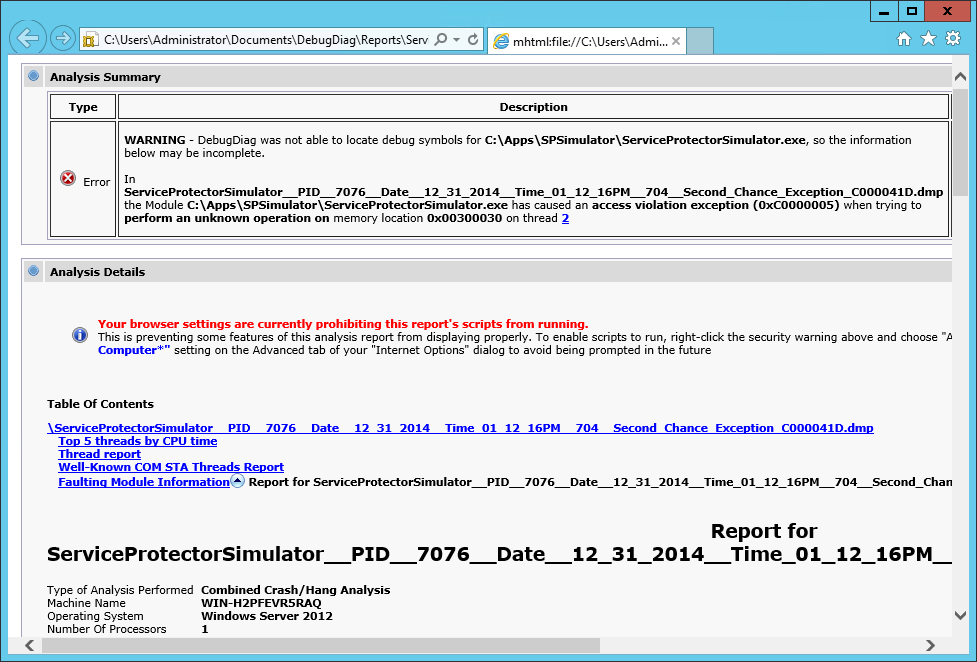
And click the Start Analysis button to get going! After a period of “thinking”, the application will open its report in your browser:
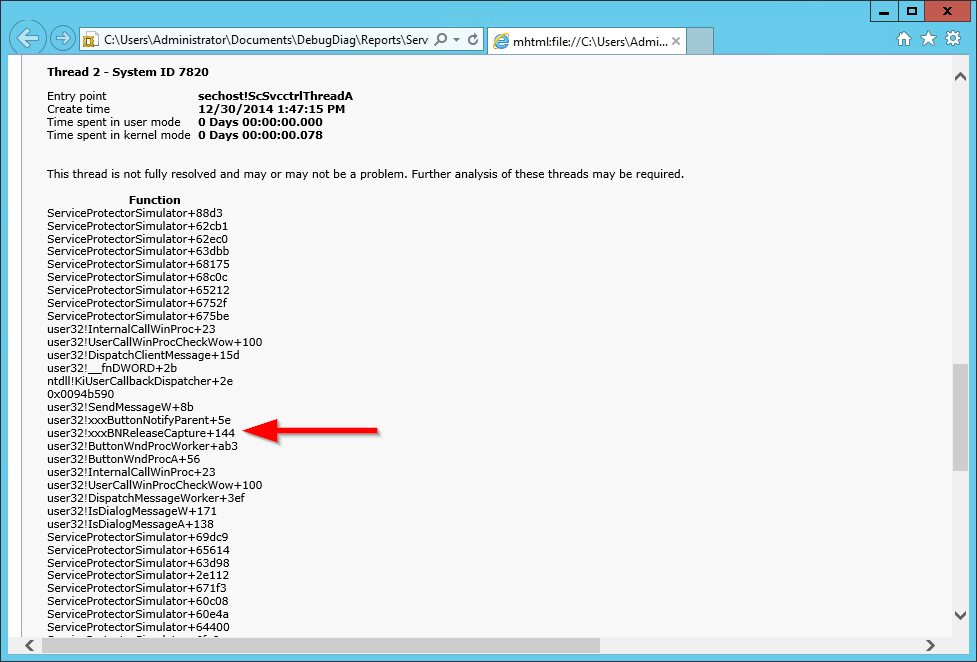
Scan the report for any smoking guns. Thread call stacks may be particularly useful. For example, this stack trace tells us that our service crashed while handling a button press. (This is not surprising though – that is what we did to force the crash in our testing!)
Hopefully you will find a telltale sign to help you identify and fix your problem.
Also Find Memory Leaks in your Windows Service
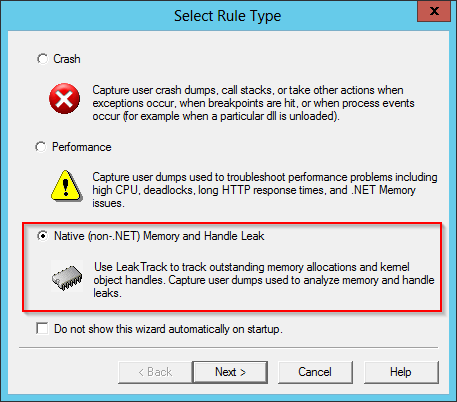
If your windows service is consuming too much memory instead of crashing, configure the collector to watch for memory leaks:
The final report will detail all outstanding memory allocations.
Good hunting!

