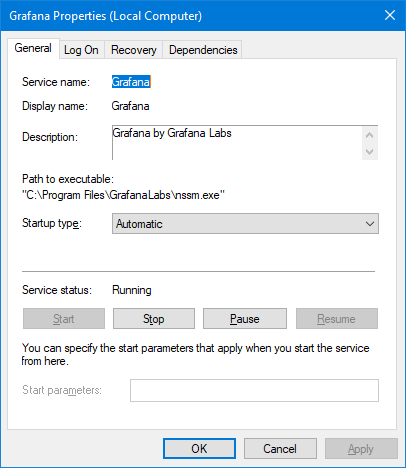
Version 7.0 and later can be installed as a Windows Service, to start automatically whenever your computer boots:
-
If necessary, download and
install Grafana.
We recommend using the Windows MSI installer, which has the option to set up Grafana as a Windows Service. (You have to configure the service manually if you download and extract the zip file.)
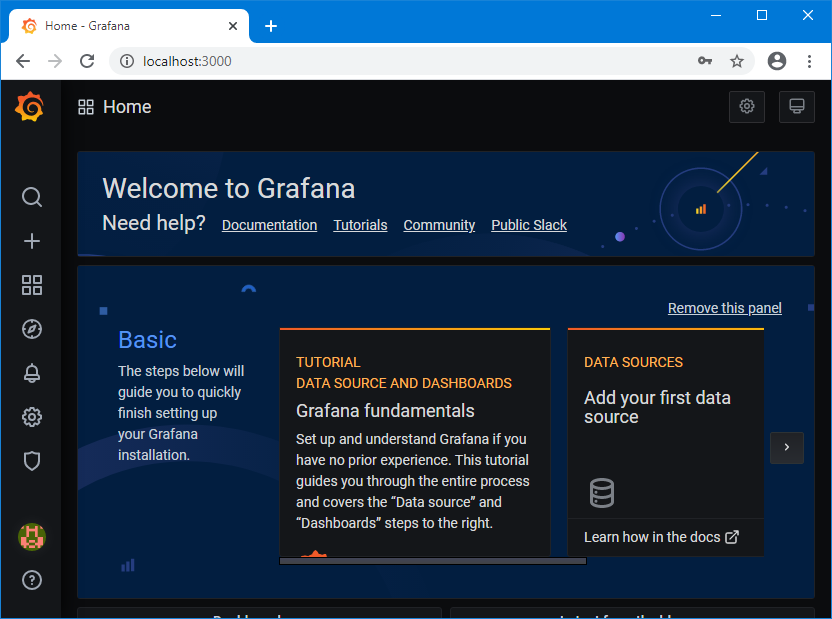
After installation, make sure everything
works as expected:
-
Download and
install
Service Protector, if necessary.
-
Start Service Protector.
-
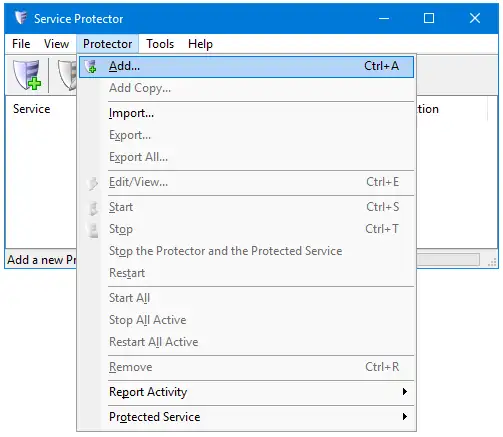
Select Protector > Add to open the Add Protector window:
-
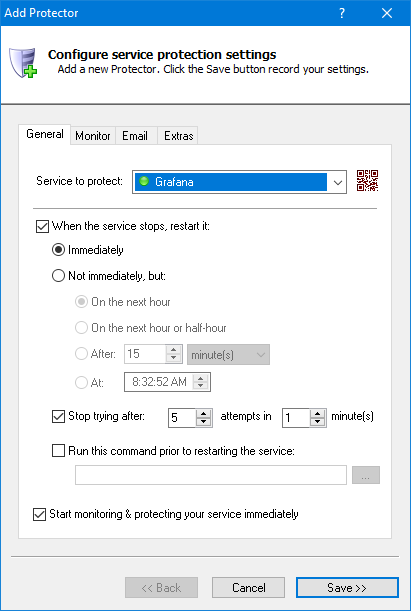
On the General tab, in the Service to protect field, select the Grafana windows service:
-
To monitor and restart Grafana if it stops serving HTML pages (at http://localhost:3000),
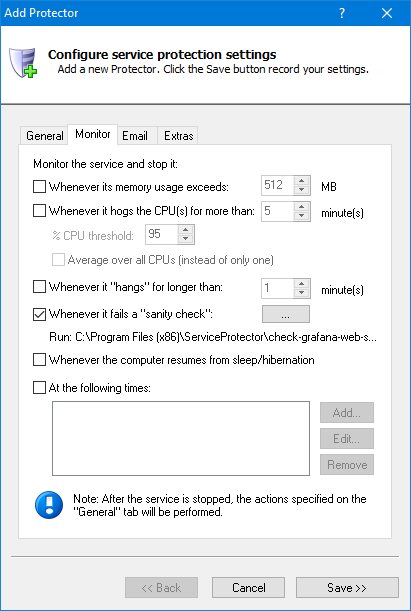
switch to the Monitor tab. We'll set up a failure detection batch file to detect when the Grafana web server has failed.
-
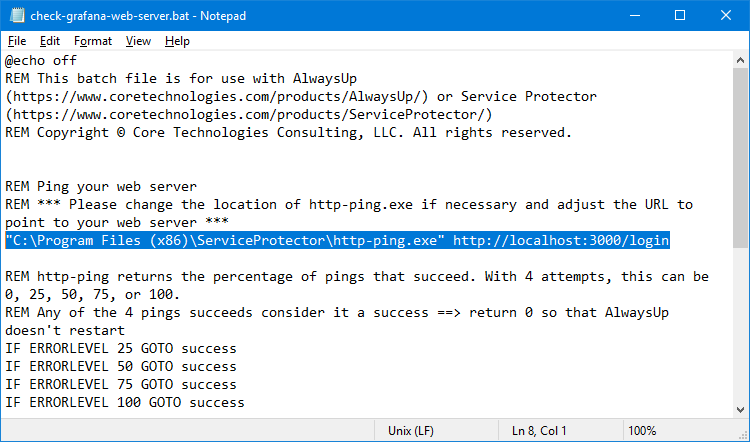
Follow these instructions to create the failure detection BAT file.
We have called ours check-grafana-web-server.bat and placed it in the Service Protector installation folder
(C:\Program Files (x86)\ServiceProtector).
-
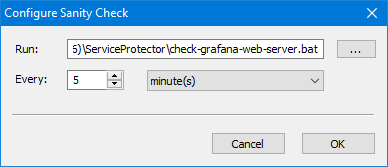
Click the "..." button in the Whenever it fails a "sanity check" section to bring up the Configure Sanity Check window.
Specify the full path to the batch file in the Run field.
And change the Every controls to a frequency that works in your environment. More time means less frequent checks and less load on the server but with a reduced sensitivity to failures. 5 minutes is good for us:
-
Click the OK button to save your settings.
Here's what the Monitor tab should look like when you're done:
-
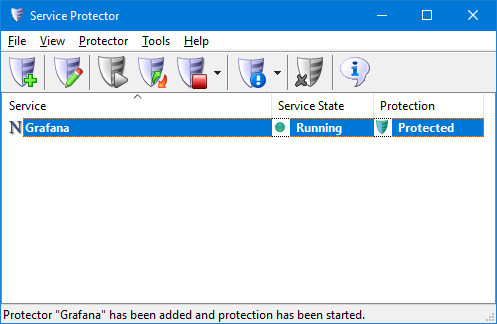
Click the Save button to record your settings. In a few seconds, a new entry will appear in the Service Protector window.
The green shield indicates that Service Protector is already actively monitoring Grafana to detect failures:
-
That's it! Next time your computer boots, Grafana will start automatically and Service Protector will babysit the service to promptly restart it if it terminates for any reason.
We encourage you to edit your Grafana entry in Service Protector and browse through the many other settings that may be appropriate for your environment.
For example, send an email when the service fails, schedule a regular restart to cure memory leaks, and much more.


